Netdata is a monitoring tool designed to run on all systems, both physical and virtual. It runs on Linux, FreeBSD, macOS, Kubernetes, Docker, and all their derivatives and is an extremely optimized real-time (per second) performance monitoring utility for Linux systems. It can be installed on systems without interrupting the current running applications.
Netdata monitors:
- CPU usage, frequency, etc.
- RAM, swap, and kernel utilization
- Disk usage
- Network interfaces
- monitors Linux firewall connections, events, errors, etc.
- Processes (running, blocked, forks, active, etc)
- System Applications with the process tree
- Apache and Nginx Status Monitoring
- MySQL database monitoring
- Postfix email server message queue
- Hardware sensors
- SNMP devices
This document outlines the fundamental steps for installing and configuring the Netdata monitoring tool in any Debian/Ubuntu or RHEL/CentOS/Fedora system.
Step 1: Netdata installation
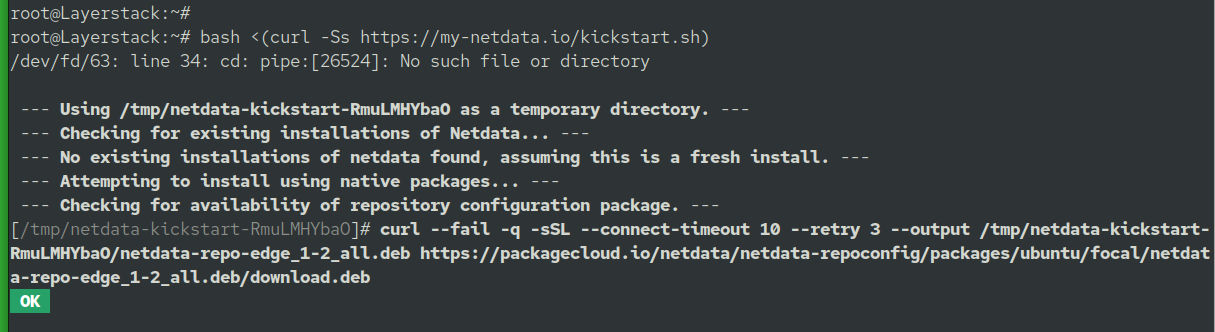
To install Netdata, run the one-line installation script that will install the latest netdata and also keep it up-to-date automatically
# bash <(curl -Ss https://my-netdata.io/kickstart.sh)
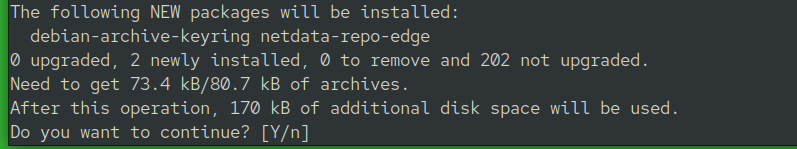
When prompted press Y to continue installation:
After running the script, Netdata installs all requirements using your Linux native package manager.
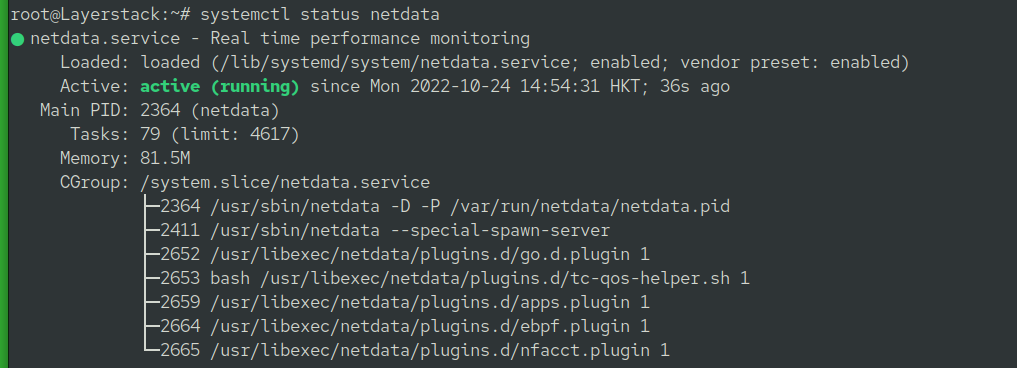
Check the status of the Netdata application.
# systemctl status netdata
Step 2: Changing the default port
Netdata port by default is 19999.
Edit the Nedata configuration file.
# vim /etc/netdata/netdata.conf
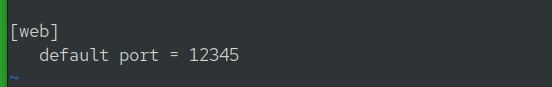
Add the following content to the file.
[web]
default port = 12345
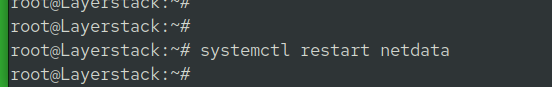
Restart the Netdata application.
# systemctl restart netdata
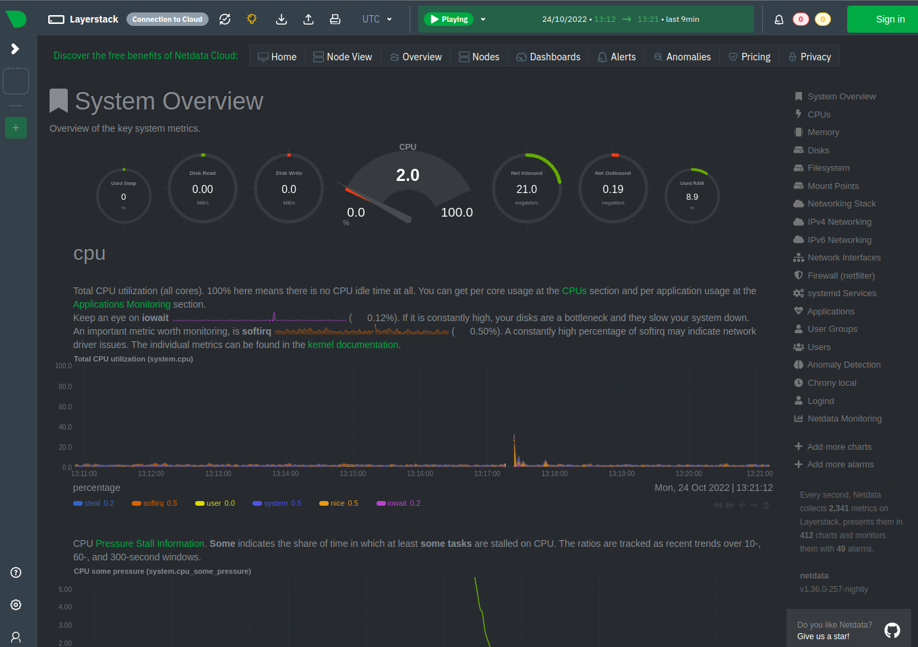
Step 3: Get Started
Go to the browser and use the IP and port to enter to Netdata Webpage:
http://123.123.123.123:12345
Related Tutorials