How to use top and htop Linux command for Process Management
The Cloud Servers are often used for General purposes, Computation intensive and Memory intensive operations. To closely monitor them, we use certain tools, commands and utilities so that we can get the better of them.
This tutorial will discuss such a command-line utility that helps users to view the background process running in the Linux environment.
top command
top command is used to show the background Linux processes. A dynamic real-time view of the running system can be viewed by using this utility. More accurately, summarized information of the system and the list of processes or threads based on CPU usage, which is currently managed by the Linux Kernel can be viewed as the output of the command.
Often this utility is being used by System Administrators, that provide a limited interactive interface for process manipulation as well as a much more extensive interface for personal configuration encompassing every aspect of its operation. By default, 3 secs, the list will be updated.
# top

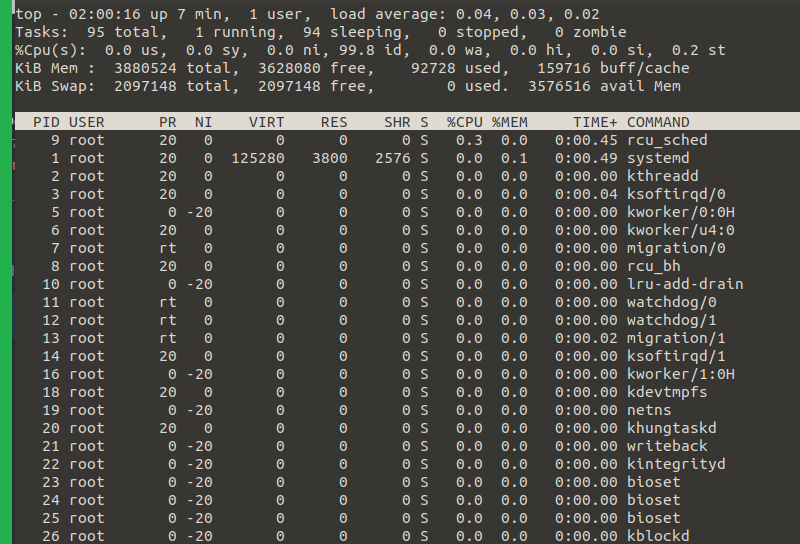
To understand the entries for 1st line, current time, duration since the system is up and running, active user sessions, and average load on the system for last 1 min, 5 mins and 15 mins.
The 2nd line shows information about total number processes, number of running processes, number of sleeping processes, number of stopped processes, and number of zombie processes.
The following line shows the CPU usage in percentage as the below describes certain values:
us: user
sy: system
ni: nice
id: idle time
wa: IO-wait
hi: hardware interrupts timing
si: software interrupts timing
st: time stolen from this VM by the hypervisor
The next two lines in the output, show the information related to RAM and swap memory usage.
Now comes processes related information, process ID, user who owns the process, process priority, nice value of the process, virtual, physical, and shared memory used by the process, process status, CPU and RAM usage, time of activity, and command that runs in that particular process.
PID USER PR NI VIRT RES SHR S %CPU %MEM TIME+ COMMAND
The refresh rate can be customized, however, the default rate is 3 seconds, you can tweak them by pressing d and changing the delay value to your desired value.
To kill a process, you can press k while the top interactive terminal is running, then there will be a prompt to enter the PID and press enter. The prompt sample is shown below:
PID to signal/kill [default pid = 2387] _ < enter your PID to kill >
This will issue SIGTERM, which allows the process to be terminated gracefully. You could type in SIGKILL or another signal you wish to send; you could also enter a signal number here. For instance, SIGKILL has a signal number of 9, and SIGTERM is 15.
Sorting
The top process list can be sorted according to certain parameters:
When the top is running in the interactive terminal, you can press the following keys for desired sorted lists:
Press P: sort according to CPU utilization
Press M: sort by memory usage
Press T: sort by Time column
Press N: sort by PID number
htop command
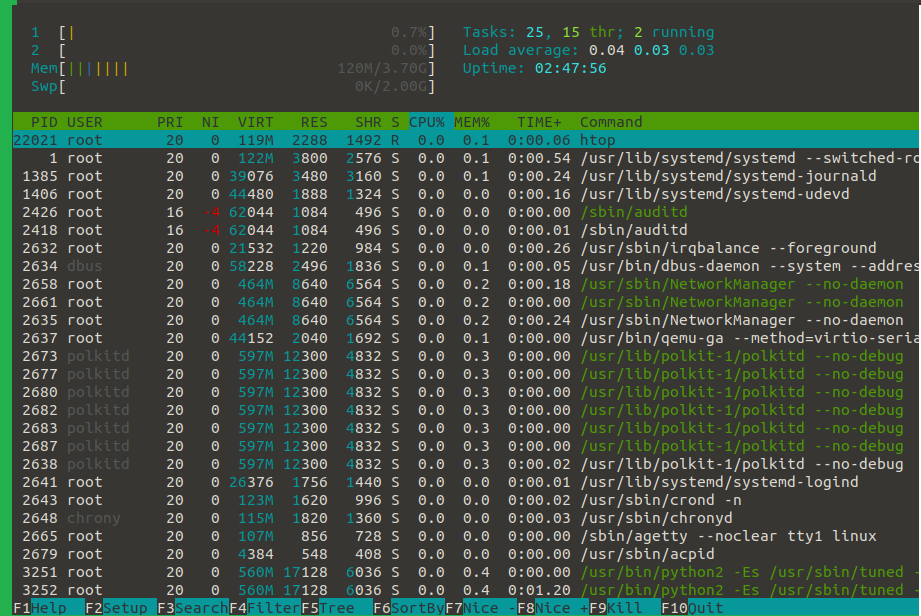
htop is a new and improved form of top command, and it includes many improvements. htop supports mouse interaction on process list, uses colour in its output and gives visual indications about processor, memory and swap usage. It encapsulates all the functionality of top, and it comes with some advanced functionalities as well.

The interactive terminal just advanced and searching, filtering and sorting options are already available in the terminal. The command option will show the entire path.
Since the output is colored and scrolled using the mouse vertically and horizontally, the operations can easily be performed. Also, you no longer needed to enter the process number or priority value to re-nice a process. By pressing e, it will show the environment of the process. If you check out the bottom of the htop interactive page, you will find the menu for actions on a process.
Therefore System Administrators may be more inclined to use htop over top due to its rich display option and ease of use.
